Xmake is a lightweight modern C/C++ project build tool based on Lua. Its main features are: easy to use syntax, more readable project maintenance, and a consistent build experience across platforms.
This article mainly explains in detail how to load and run the compiled target program, and how to debug.
Run build target
xmake also provides a run command to directly run the generated executable file for quick and easy testing, for example:
$ xmake run
hello xmake!
Adding runtime environment variables
We can also add environment variables to set the default running target program through the add_runenvs interface in xmake.lua.
Therefore, for PATH, it is very convenient to append values through this interface, and this interface supports multi-value setting, so it is usually used to set multi-value env with path sep. .
target("test")
    set_kind("binary")
    add_files("src/*.c")
    add_runenvs("PATH", "/tmp/bin", "xxx/bin")
    add_runenvs("LD_LIBRARY_PATH", "/tmp/lib", "xxx/lib")
For more description of this interface, you can see the documentation: add_runenvs interface documentation
Custom run logic
If the simple environment settings and the default loading and running rules do not meet the requirements, we can customize the on_run script to achieve more complex running logic:
For example, run the installed apk program:
target("test")
    -- ...
    -- Set a custom run script, automatically run the installed app, and automatically obtain device output information
    on_run(function(target)
        os.run("adb shell am start -n com.demo/com.demo.DemoTest")
        os.run("adb logcat")
    end)
Debugger
Command line debugging
We can also pass -d parameters, call debugger programs such as gdb/lldb, load the target file for debugging:
$ xmake run -d
xmake will use the debugger that comes with the system to load the program.currently it supports: lldb, gdb, windbg, vsjitdebugger, ollydbg and other debuggers.
[lldb] $ target create "build/hello"
Current executable set to 'build/hello' (x86_64).
[lldb] $ b main
Breakpoint 1: where = hello`main, address = 0x0000000100000f50
[lldb] $ r
Process 7509 launched: '/private/tmp/hello/build/hello' (x86_64)
Process 7509 stopped
* thread # 1: tid = 0x435a2, 0x0000000100000f50 hello`main, queue = 'com.apple.main-thread', stop reason = breakpoint 1.1
    frame # 0: 0x0000000100000f50 hello`main
hello`main:
-> 0x100000f50 <+0>: pushq% rbp
    0x100000f51 <+1>: movq% rsp,% rbp
    0x100000f54 <+4>: leaq 0x2b (% rip),% rdi; "hello world!"
    0x100000f5b <+11>: callq 0x100000f64; symbol stub for: puts
[lldb] $
Breakpoint debugging with vscode
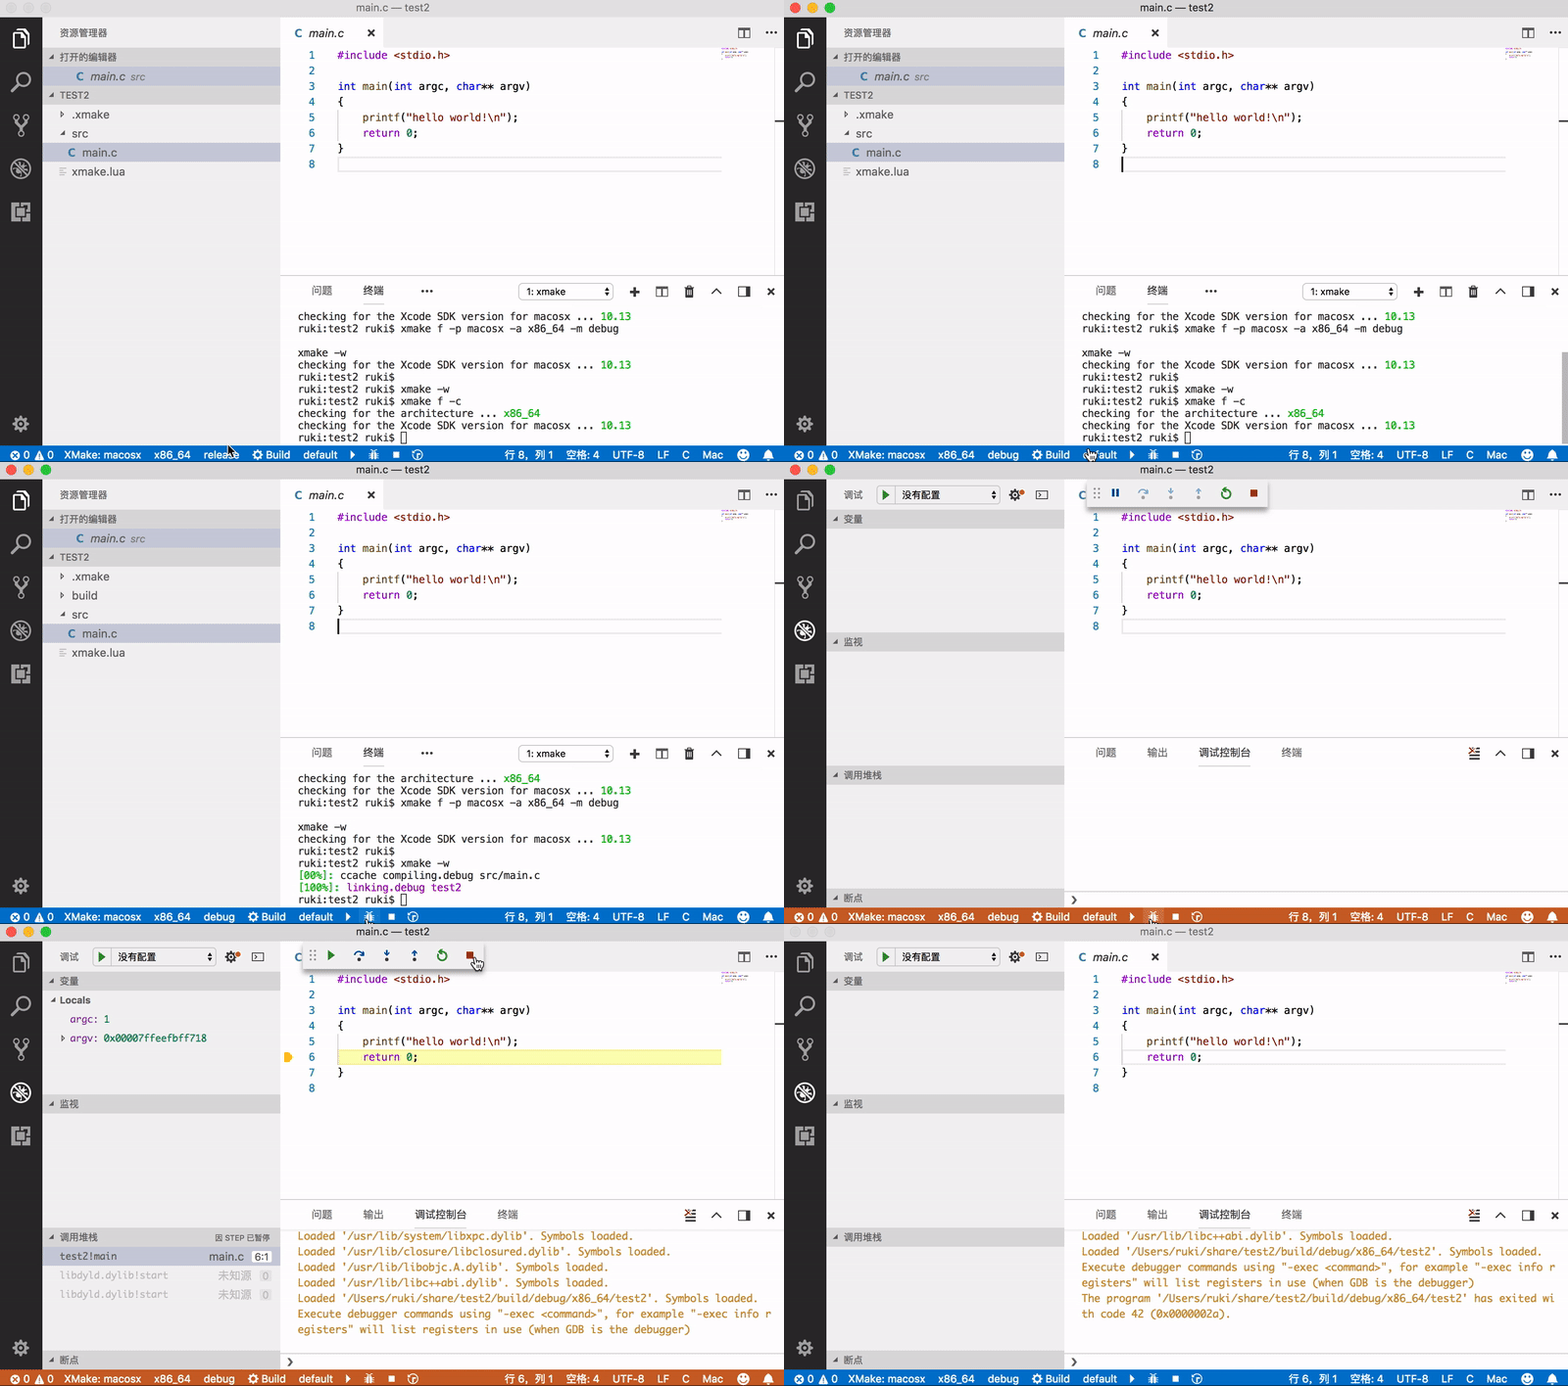
We can also use the xmake-vscode plugin to cooperate with vscode to implement breakpoint debugging support for c/c++ projects.
In addition, we need to rely on the c++ plug-in of vscode for debugging support, but since developing c/c++ programs, this plug-in is almost necessary, so there is not much problem.
Even if this plugin is not installed, xmake-vscode will load the system debuggers such as lldb/gdb/vsjitdebugger, and directly load and debug.
